Gantt charts are widely used in project management today, helping us visualize project schedules, track progress, and allocate resources efficiently. But have you ever wondered about the origins of these powerful tools? In this article, we will take a closer look at the fascinating history of Gantt charts, from their humble beginnings to their modern-day adaptations and future innovations.
Understanding Gantt Charts
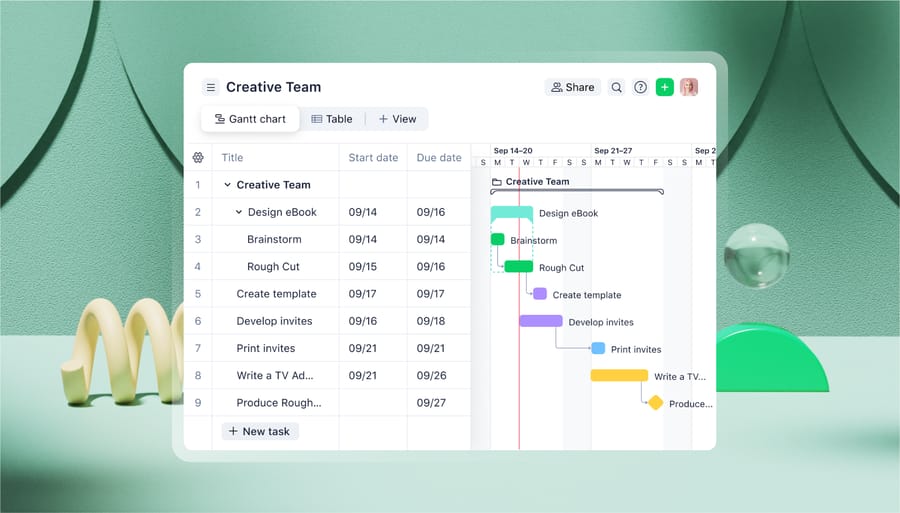
A Gantt chart is a visual representation of a project schedule, in the form of a bar chart. It provides a timeline view of tasks, showing their start and end dates, durations, dependencies, and progress. Each bar symbolizes a task, and its length represents the duration. The bars are arranged along a horizontal timeline, showing the order of tasks and their respective start and end dates. .
The Purpose and Benefits of Gantt Charts
The main purpose of a Gantt chart is to help project managers and teams plan, track, and manage projects effectively. They offer several benefits, including:
- Clear Visualization: A visual representation of the project timeline makes it easier to understand and communicate the project plan. It also depicts the project's critical path, which is the sequence os tasks that determines the project's overall duration.
- Task Dependencies: The dependencies between tasks help to identify critical paths and potential bottlenecks.
- Resource Allocation: Visualizing task durations and resource requirements aids in resource allocation and workload balancing.
- Flexibility: Being able to adjust the start and end dates of tasks allows for the simulation of different scenarios, and this helps to manage unexpected delays, resource constraints, or scope changes.
- Progress Tracking: Monitor task progress, identify delays, and take corrective actions.
- Communication and Collaboration: Enhance communication and collaboration among team members, stakeholders, and clients by providing a shared understanding of project timelines and milestones.
- Transparency and Accountability: Displaying task progress and deadlines will encourage timely task completion and fosters a culture of accountability.
The Origins of Gantt Charts
Now that we have a good understanding of what Gantt charts are and their benefits, let's explore their origins. The story of Gantt charts begins with the remarkable man behind their creation - Henry Gantt.
The Man Behind the Chart: Henry Gantt
Henry Gantt was an American mechanical engineer, management consultant, and pioneer in the field of scientific management. Born in 1861, Gantt made significant contributions to project management, developing techniques that revolutionized the way projects were planned and executed.
Gantt's interest in project management began during his time at the Stevens Institute of Technology, where he studied mechanical engineering. It was here that he first recognized the need for a visual representation of project schedules to effectively track progress and allocate resources. After completing his studies, Gantt embarked on a successful career that saw him working on various projects across different industries. His expertise in project management led him to be involved in notable undertakings, such as the construction of the Hoover Dam and the development of the interstate highway system.
The First Gantt Chart and Its Use
Although not the first to use bar charts for project planning, Henry Gantt's contribution was the development of a more comprehensive and practical version known as the Gantt chart. Gantt introduced his charting system in the early 20th century while working on various projects, including the construction of the Hoover Dam.
One of the key features of Gantt's chart was its ability to display interdependencies between tasks. By using horizontal bars to represent tasks and marking their start and end dates, Gantt successfully visualized the project schedule in a way that was easy to comprehend and analyze. Moreover, Gantt's chart allowed project managers to track the progress of each task by shading the completed portion of the bar, providing a clear indication of how much work had been done. This feature proved invaluable in monitoring project timelines and identifying potential bottlenecks.
Evolution of Gantt Charts Through the Years
As Gantt charts gained popularity, they continued to evolve and adapt to various industries and project management practices. Let's explore some significant milestones in the history of Gantt charts.
Gantt Charts in the Industrial Revolution
In the late 19th century and early 20th century, as industries were undergoing a period of rapid growth and technological advancements, Gantt charts found their application during the Industrial Revolution. Manufacturing and construction projects benefited immensely from the visual representation and planning capabilities offered by Gantt charts. These tools facilitated resource allocation, minimized idle time, and improved productivity. They even played a vital role in coordinating complex projects and optimizing workflows, leading to increased efficiency in the industrial sector.
During the construction of the Brooklyn Bridge, Gantt charts were used to schedule the various stages of construction, including the placement of caissons, the erection of towers, and the laying of cables. This allowed the project managers to allocate resources effectively so that each task was completed in a timely manner. In the manufacturing industry, Gantt charts were utilized to plan and track the production of goods. For instance, Henry Ford famously used Gantt charts to optimize the assembly line process in his automobile factories, leading to increased efficiency and reduced production time.
The Role of Gantt Charts in World War I
The widespread adoption of Gantt charts gained further momentum during World War I. With the need to manage and coordinate massive military projects, Gantt charts became instrumental in planning and executing tasks on a large scale. During the war, Gantt charts were used to schedule production, allocate resources, and track progress in building military equipment, infrastructure, and logistics. They provided commanders and project managers with a visual representation of complex operations, aiding decision-making and overseeing the timely completion of critical tasks.
During the construction of trenches and fortifications, Gantt charts helped to plan and coordinate the various stages of construction, including digging, reinforcing, and camouflaging. This allowed the military to efficiently allocate resources so that the construction was completed within the required timeframe. In addition, Gantt charts were used to track the production of weapons and ammunition, so that the military had a steady supply of necessary resources. This helped in streamlining the production process and meeting the demands of the war effort.
Gantt Charts in Today's World
In today's rapidly evolving business landscape, Gantt charts continue to play a crucial role in project management. Let's explore how Gantt charts are used in various industries and the impact of technology on their effectiveness.
Gantt Charts in Project Management
Gantt charts have become an indispensable tool in project management, enabling teams to plan and track projects with precision. From small-scale initiatives to large-scale construction projects, Gantt charts help project managers allocate resources, identify critical paths, manage dependencies, and monitor progress, via a comprehensive overview of project timelines, milestones, and deliverables. This enables effective communication, resource management, and risk mitigation, ultimately contributing to the successful completion of projects.
The Impact of Technology on Gantt Charts
Advancements in technology have had a profound impact on the effectiveness and accessibility of Gantt charts. Today, project management software offers robust Gantt chart functionalities that enhance collaboration, automate updates, and provide real-time insights into project progress. While cloud-based project management tools enable distributed teams to work together seamlessly, with instant access to up-to-date Gantt charts and project data ,mobile applications allow project managers and team members to view and update Gantt charts on the go.
The Future of Gantt Charts
As we move forward, the evolution of Gantt charts is expected to continue, keeping pace with the changing demands of project management. Let's explore some predictions for the future of Gantt charts and their lasting legacy.
Predicted Developments and Innovations
One of the anticipated developments in Gantt charts is the integration of artificial intelligence and machine learning capabilities. Intelligent algorithms may be utilized to analyze project data, predict potential delays or risks, and provide recommendations for optimizing project schedules. What's more, the integration of Gantt charts with emerging technologies, such as virtual reality and augmented reality, could facilitate immersive project planning experiences, enabling stakeholders to visualize projects in three-dimensional space and make informed decisions.
The Lasting Legacy of Gantt Charts
The enduring legacy of Gantt charts lies in their ability to simplify complex projects, improve communication and collaboration, and enable efficient resource management. Henry Gantt's innovation has stood the test of time, transforming the way projects are planned, executed, and controlled.
As project management practices evolve, Gantt charts will continue to adapt, embracing new technologies and methodologies to remain a vital tool in the project manager's arsenal. Their versatile nature and visual representation make Gantt charts an indispensable component of successful project management.
Maximize media attention by leveraging press release templates in Wrike. Begin your free trial today, project your brand's story effectively, and gain the recognition you deserve.
Note: This article was created with the assistance of an AI engine. It has been reviewed and revised by our team of experts to ensure accuracy and quality.