Key takeaways:
- What is a Gantt chart? It’s a visual project management tool that helps plan, schedule, and track project progress, initiated by Henry Gantt in the early 1900s.
- How does one prepare for creating a Gantt chart? Define project goals, list key deliverables, and set metrics for evaluating success to align the chart with project priorities.
- What are essential elements of a Gantt chart? Include tasks with specific descriptions, durations, dependencies, and assign resources effectively to ensure accountability and clarity.
- What role do milestones play? Milestones mark significant events or deadlines, helping track project progress and ensuring focus on critical achievements.
- Why is monitoring important? Regular updates ensure the Gantt chart accurately reflects project status, accommodating changes and maintaining stakeholder collaboration.
Projects have a way of getting messy. Deadlines sneak up, tasks overlap, and team members struggle to stay aligned. That’s why having the right project management tool, like a Gantt chart, can help you stay on top of even the most complex projects.
Conceived by Henry Gantt in the early 1900s, the Gantt chart is a visual tool that helps you plan, schedule, and track the progress of a project.
In this article, we’ll walk you through the process of creating a Gantt chart for your project. You’ll learn how to structure your tasks, define the project scope, and keep your team focused.
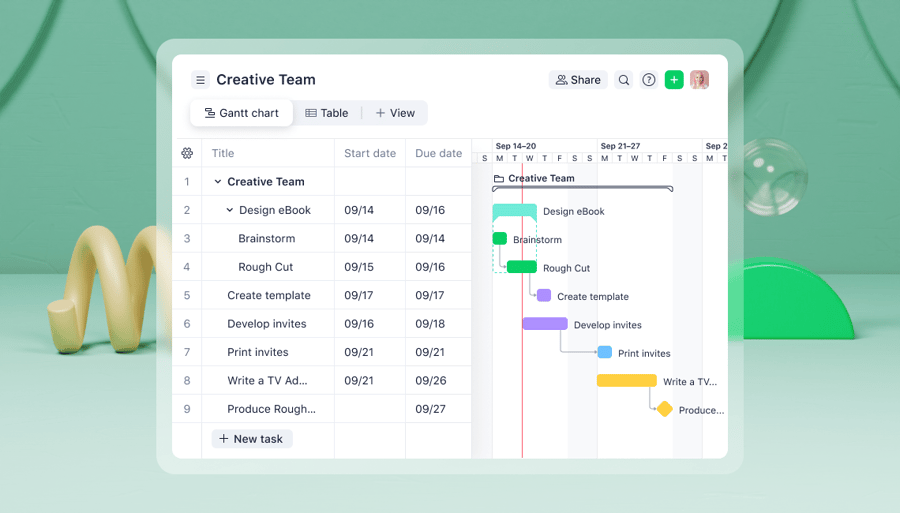
We’ll also show you how to use a Wrike Gantt chart to map your project plan.
Preparing to create your Gantt chart
Before you jump into making a Gantt chart, it’s important to prepare. A little planning upfront can save you time and ensure your chart truly reflects your project’s needs. Here’s what to think about before you start building your Gantt chart.
Define your project’s goals
Every project begins with a purpose. Start by asking, “What is this project meant to achieve?” Clearly defining your goals ensures that your Gantt chart aligns with your priorities and helps your project team stay on track.
Gantt charts help you see the big picture and they become more meaningful when you know exactly why you’re creating it. This clarity shapes how tasks, timelines, and resources are organized.
List key deliverables
Deliverables are the tangible outcomes your project aims to produce. These deliverables represent the goals your team is working toward and should be at the center of your planning process. Aim to create a Gantt chart with deliverables clearly highlighted to keep everyone focused on priorities.
Set clear metrics
Metrics help you evaluate whether your project is on track, identify areas for improvement, and provide a concrete way to demonstrate success to stakeholders. Without well-defined metrics, it’s easy for a project to lose focus or deviate from its objectives.
What are the specific metrics to set?
- Task completion rate: Percentage of tasks finished versus total tasks
- On-time deliverables: Number of deliverables completed by their deadlines
- Milestone progress: Milestones achieved compared to planned milestones
- Resource utilization: Percentage of team or tools being actively used
- Schedule variance: Difference between planned and actual timelines for tasks
Prepare for task overlaps
Projects rarely run in a straight line. Some tasks will overlap, while others might have gaps or waiting periods. Preparing for these dynamics means your Gantt chart reflects reality. How can you achieve this?
- Identify tasks that can run simultaneously.
- Spot tasks with built-in delays, such as wait time for client approvals.
- Include buffer periods to absorb unexpected delays.
- Ensure resources are not overloaded during overlapping tasks.
- Highlight critical overlaps that require extra coordination.
7 steps to make a Gantt chart
Now, how do you turn these goals, deliverables, and metrics into an actionable plan? All it takes is seven steps. Here’s how to make a Gantt chart that keeps your project organized.
Step 1: Choose the right Gantt chart tool
Start by thinking about the size and complexity of your project.
- Are you managing a small team?
- Are you coordinating an entire project with multiple tasks?
If it’s a simple project, free tools or basic templates might do the trick. For larger projects, consider project management software that includes Gantt charts as a built-in feature.
Here are the right questions to ask when you want to choose a Gantt chart:
- Can you set up your chart quickly, even if you’re new to it?
- Does the tool let you adjust the project status?
- Can project team members view, update, or comment on tasks?
- Does the tool work well with other project management software you already use?
There are popular options and even free Gantt chart templates available in spreadsheets. Choose a tool that balances functionality with simplicity so you don’t spend more time learning the tool than actually managing your project.
Step 2: Set up your project timeline
Now that you’ve chosen your Gantt chart maker, it’s time to set up your project timeline.
Every project has a beginning and an end. Identify your project’s start and end date and add them to your Gantt chart. You can decide how detailed your project schedule should be. Will your chart show daily, weekly, or monthly progress?
For shorter projects, a daily timescale works best. For longer projects, like building a website, a weekly or monthly scale might make more sense. Adjust the timescale in your tool so it fits your project plan.
You can also decide on your Gantt chart format. Depending on your project tasks, here are the different formats you might consider:
- Bar chart
- Stacked bar chart
- Baseline comparison chart
- Color-coded chart
- Hierarchical chart
Choose the format that makes your timeline easy to read and instantly understandable.
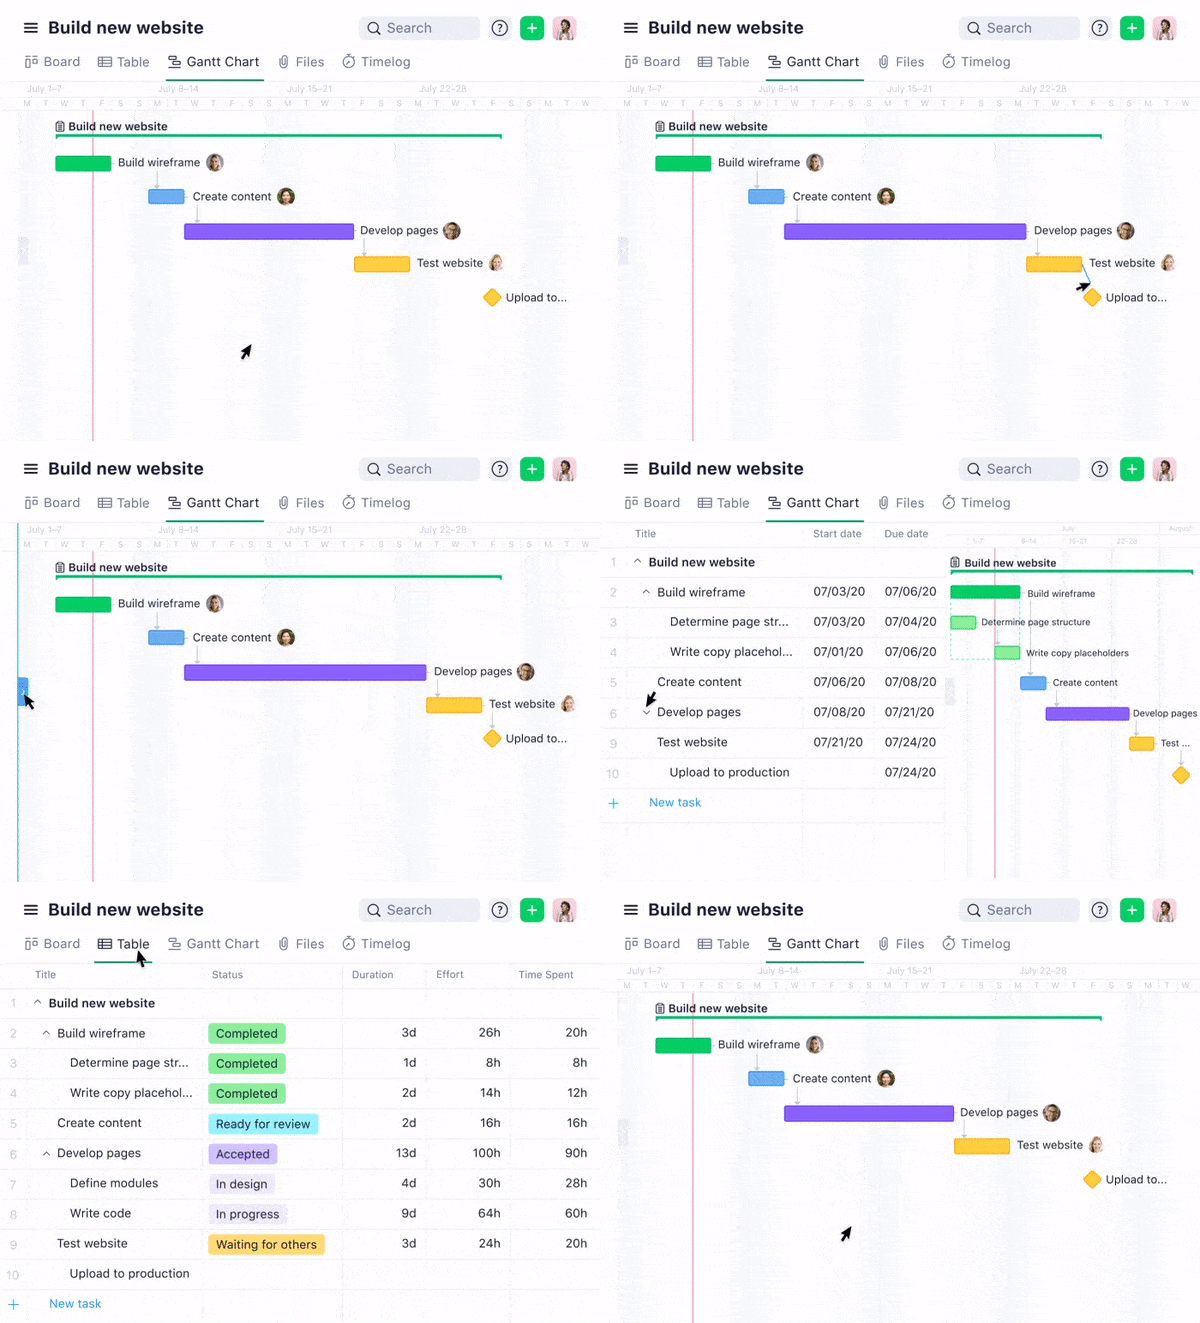
Step 3: Add tasks to your Gantt chart
Tasks are one of the major components of a Gantt chart. When listing your tasks, it’s important to be specific.
For example, if you’re working on a design project, avoid vague descriptions like “Work on design.” Instead, break tasks into actionable steps, such as “Create wireframes” or “Design logo concepts.” This clarity makes it easier to monitor your project status and keep everyone accountable.
Next, figure out the order of the tasks.
- Which tasks need to be done first?
- Are there tasks that can only start after others are finished?
For instance, “Test prototypes” should follow “Build prototypes.” Accurately sequencing tasks is key to a successful project.
In most Gantt charts, each task listed appears on the vertical axis. Add your tasks here, aligned with the timescale on the chart.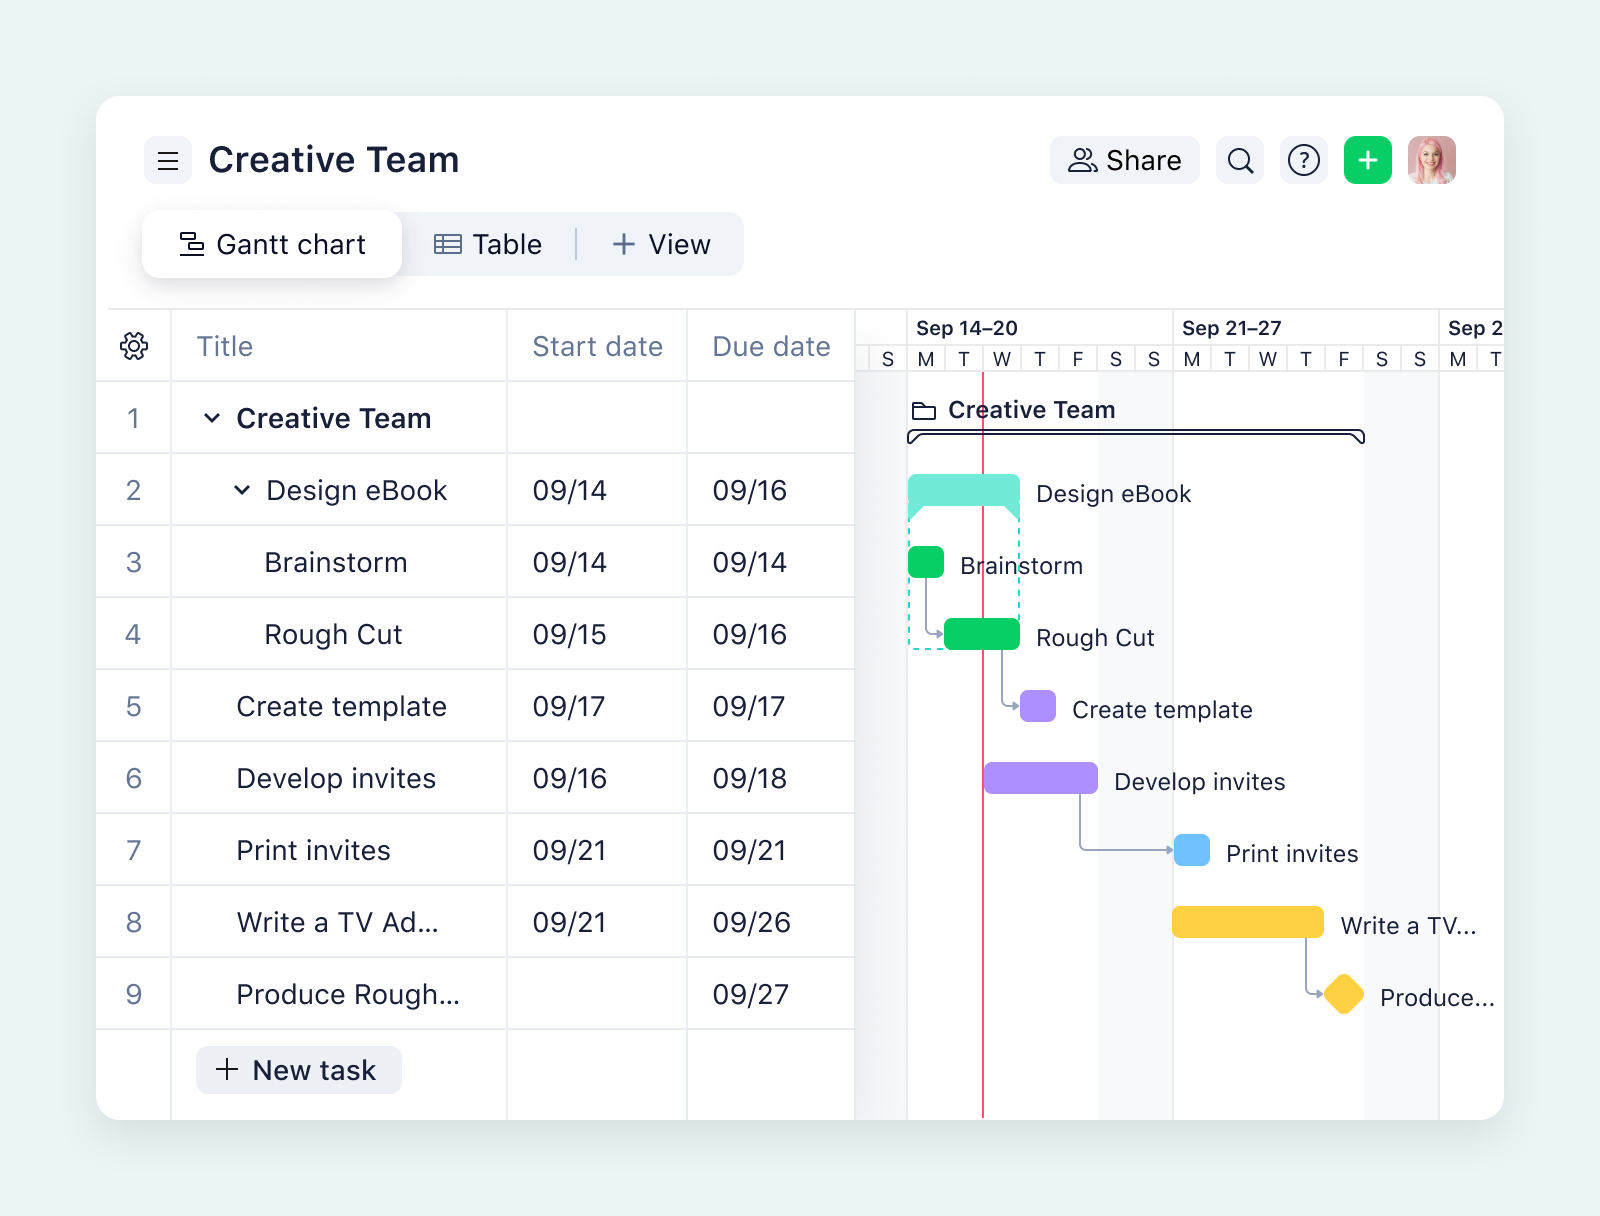
Step 4: Incorporate task durations and dependencies
How do you use Gantt charts to set durations? Start by estimating the time each task will take. Durations help you map out a clear project timeline, so be as precise as possible. Here’s how to get it right:
- Break down large tasks into smaller, manageable ones.
- Use previous project data to estimate realistic durations.
- Account for buffer time in case tasks run longer.
- Consider external factors like holidays or delays.
- Review dependencies to avoid overlapping time frames.
There are different types of dependencies used in project management that can help you arrange your tasks in the right order.
- Finish to start: One task must finish before another begins.
- Start to start: Two tasks start at the same time.
- Finish to finish: Two tasks must finish together.
- Start to finish: This is a rare situation where one task starts before another ends.
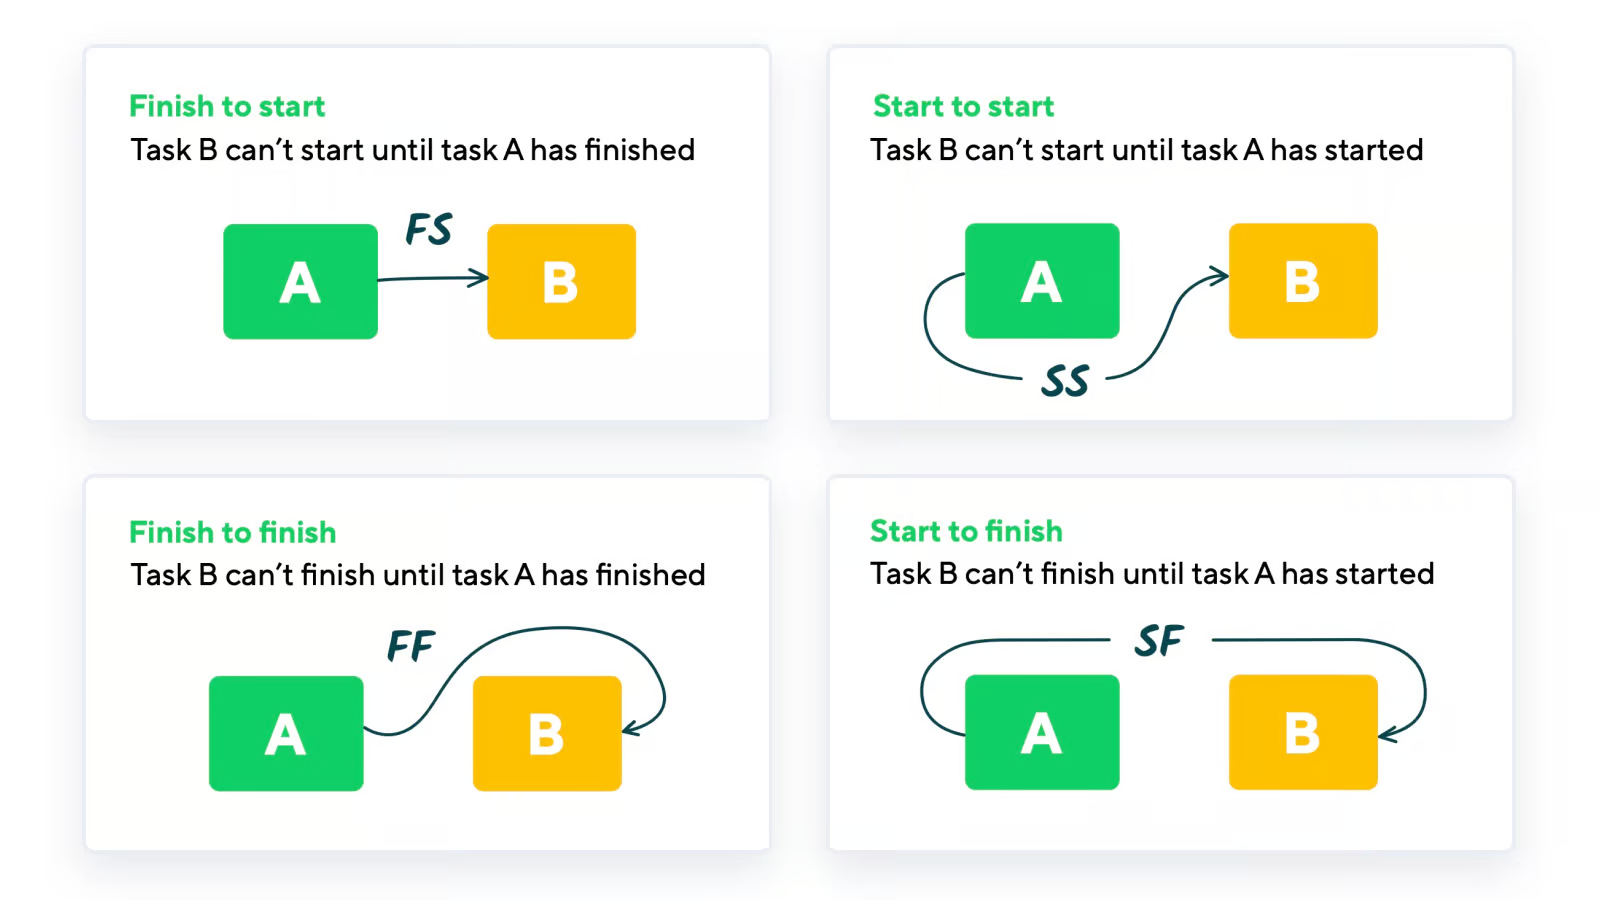
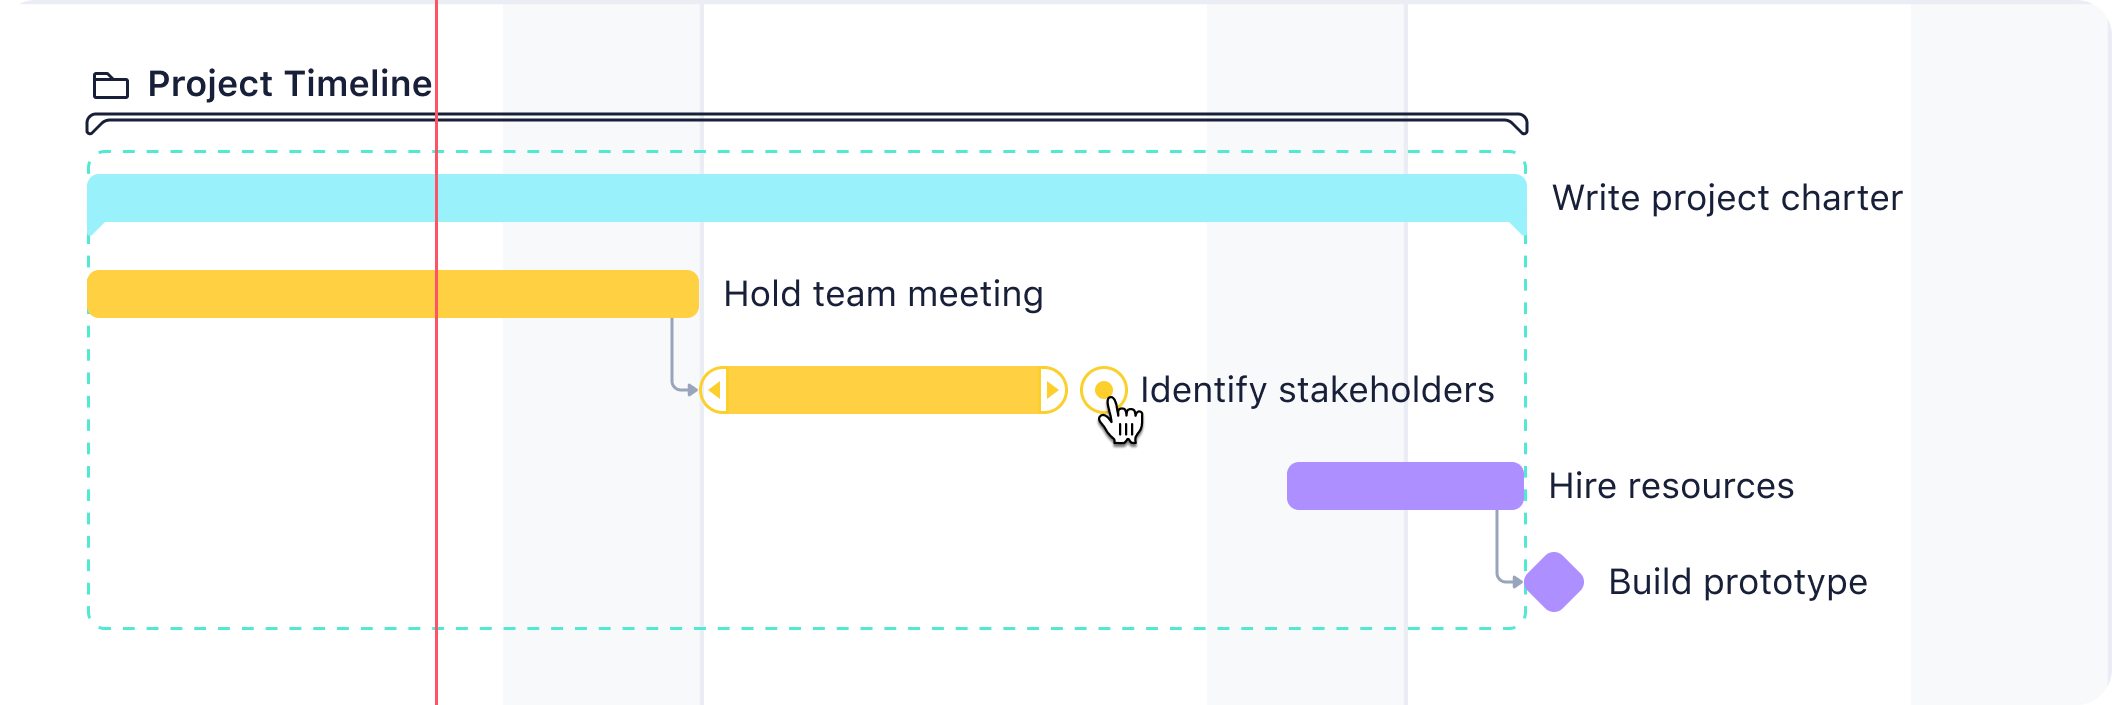
In a Gantt chart, tasks should be connected through dependencies. Tasks without any connections, often called “hanging” tasks, are discouraged under PMBOK standards. These tasks can disrupt project planning and analysis by creating gaps in the workflow.
Most modern Gantt charts used today allow you to visually connect tasks with lines or arrows. Add these links to show relationships between tasks to eliminate bottlenecks.
Step 5: Assign resources to tasks
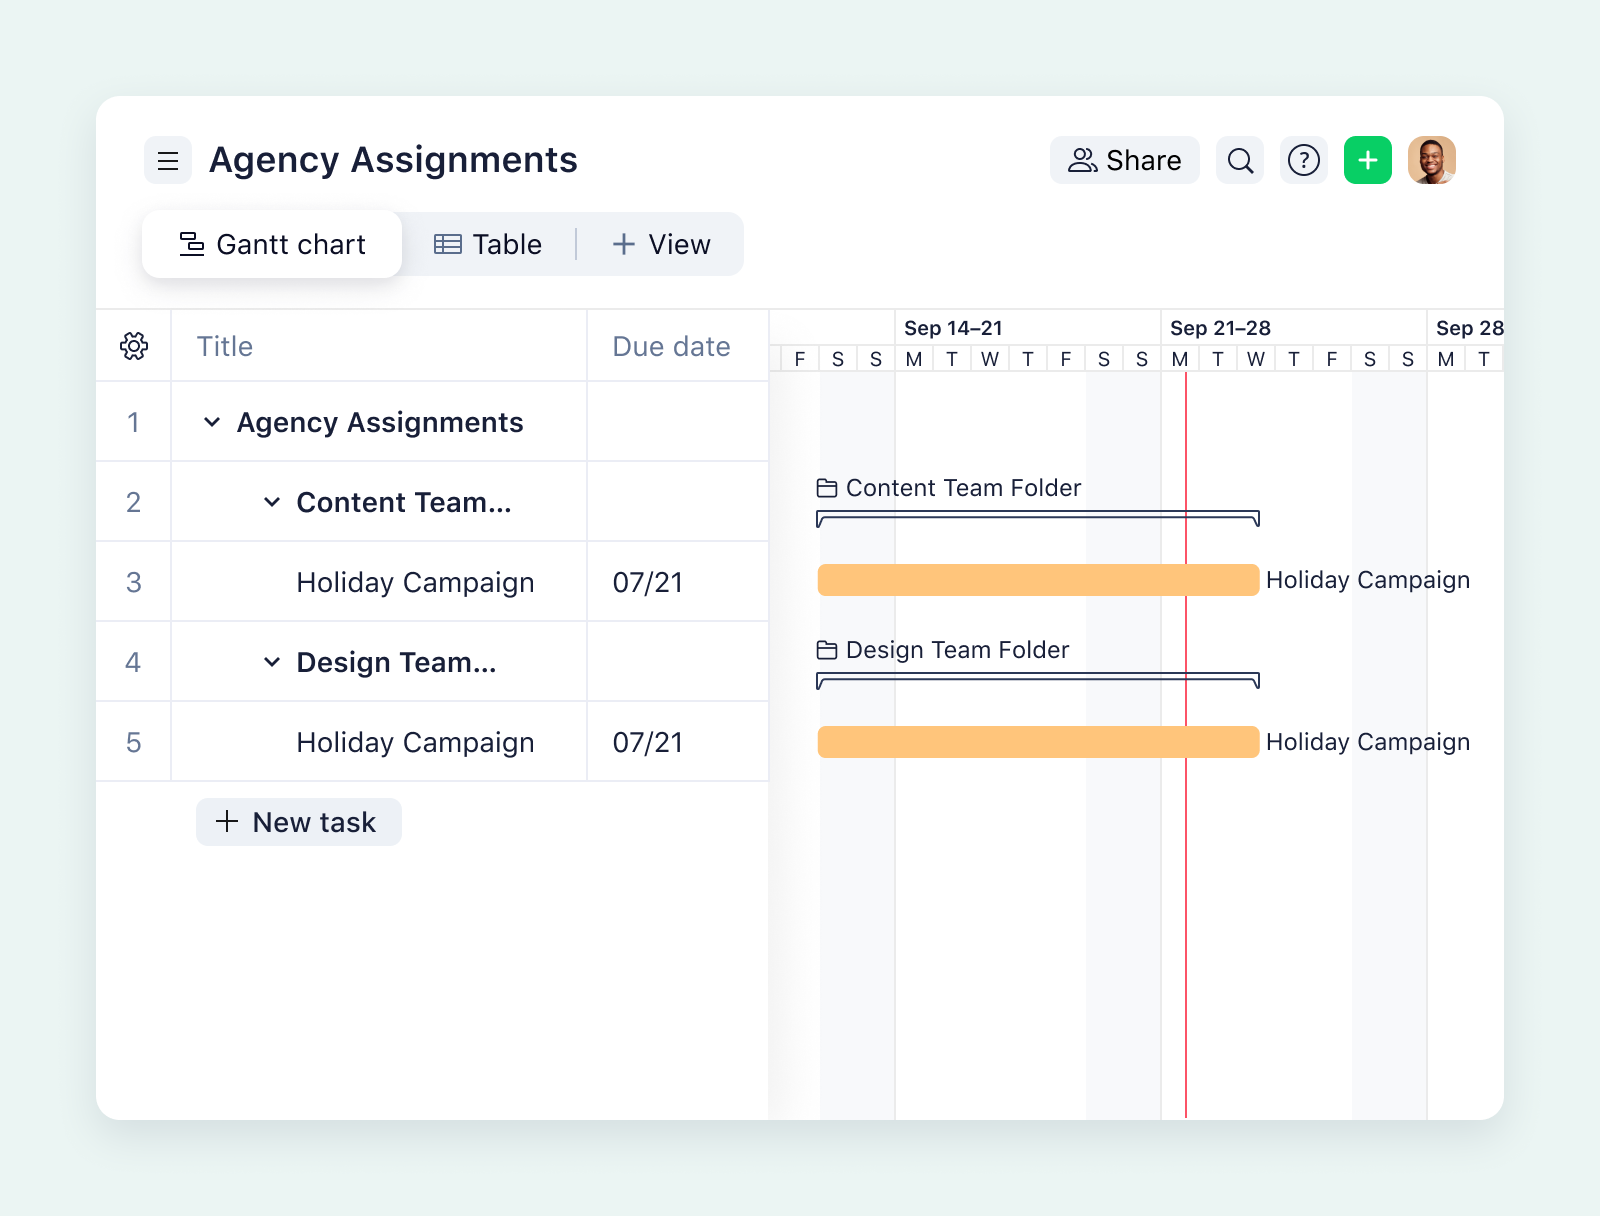
Resources include the people, tools, and materials needed to complete your project. It’s your job to assess what’s required to complete each task successfully.
Assign tasks to the team members or tools that fit best. For example, a graphic design task should go to someone skilled in that area, while technical tasks should be assigned to developers or engineers.
Spread the workload evenly across your project team. Add resource labels or icons directly to your chart. For instance:
- Use team member names beside tasks.
- Add symbols or tags to show required tools or budgets.
- Highlight tasks that require approvals to make them stand out.
As the project progresses, keep an eye on resource allocation. If priorities shift or team members become unavailable, use the Gantt chart to reassign tasks or redistribute workloads.
Step 6: Add milestones to track progress
With tasks and resources in place, it’s time to add milestones. Think about major events or deadlines in your project. These could include:
- Approval stages (e.g., design approval, final review)
- Deliverables (e.g., a completed report or prototype)
- Phase transitions (e.g., moving from planning to execution)
- External deadlines (e.g., client submissions or regulatory filings)
Label each milestone with specific, descriptive names. For instance:
- Kickoff meeting completed
- Research phase finalized
- Event launched
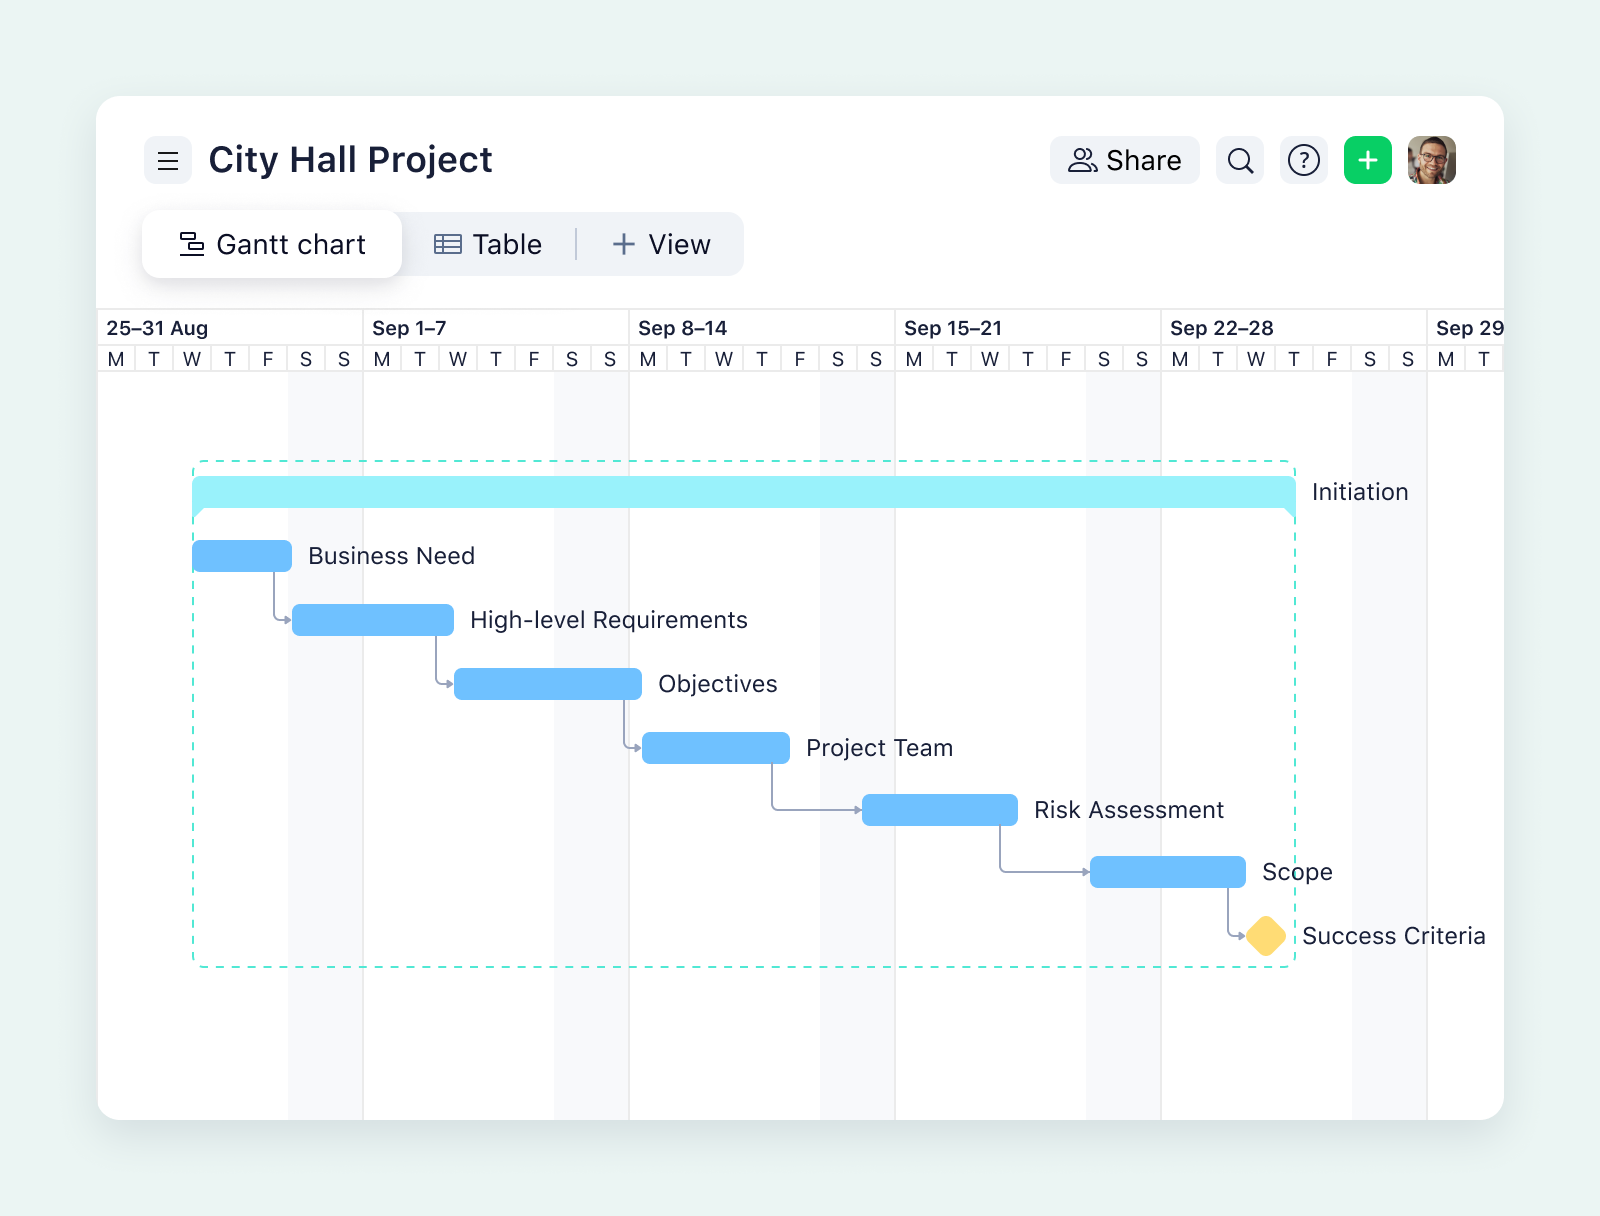
In a modern Gantt chart, milestones are typically represented by symbols like diamonds or dots. Place them at the exact point on your project timeline when the milestone is due. This visual placement makes it easy to spot key moments at a glance.
Step 7: Monitor and update your Gantt chart
Creating your Gantt chart is just the beginning. To deliver a complete project that continually stays on track and within budget, you’ll need to monitor it regularly and make updates as needed.
Projects can evolve, tasks may take longer, deadlines might shift, or priorities can change. Keeping your Gantt chart up to date ensures it remains an accurate reflection of your project schedule.
As a project manager, encourage team members and stakeholders to share input. If they notice a task or timeline adjustment is needed, use this feedback to refine your chart. This makes your chart a collaborative planning tool rather than just a static schedule.
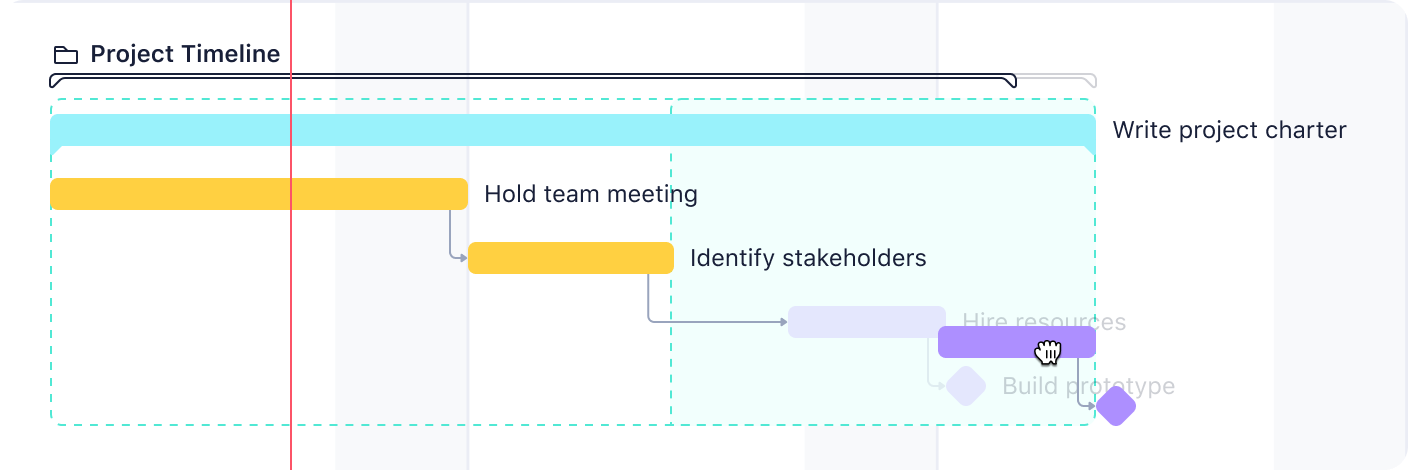
Make a Gantt chart with Wrike
Creating a Gantt chart might seem like a big task at first but once you break it into smaller steps, it becomes easy to manage any important project.
To get the most out of your Gantt chart, you need the right tool, and that’s why you should consider using a Wrike Gantt chart.
With Wrike, you can customize and create a Gantt chart in minutes. With features like drag-and-drop task scheduling and built-in Gantt chart templates, you don’t have to start from scratch.
Our charts show exactly where your tasks overlap and how they fit into the big picture.
Prefer a visual walkthrough? Watch our Wrike Gantt chart tutorial videos to get started.
If you’ve followed these Gantt chart steps and are ready to plan and schedule your next project, start your two-week free trial with Wrike.


