Key takeaways:
- What is a Gantt chart? A Gantt chart is a project management tool that visually represents tasks against time, helping to track progress and task dependencies.
- What are the benefits of using a Gantt chart? It enables detailed scheduling, accurate task planning, improved efficiency, and increased accountability in project management.
- When should you avoid Gantt charts? They shouldn’t be used for initial project planning, resource management, manual creation, or as a rigid timeline; flexibility is key.
- How can a Gantt chart help project management? It maps out schedules, clarifies dependencies, and helps ensure projects remain on track while minimizing stress.
- Why use project management software for Gantt charts? Software allows easy updates and adjustments, making it more efficient than manual tools like Excel.
You and your team are building a comprehensive resource library for your company’s website — a place where people can access eBooks, worksheets, guides, and other helpful resources.
It’s a big project filled with numerous tasks and milestones that you need to manage. It includes research and outlines, drafts and designs, landing pages, and promotional efforts.
If even one of these falls off track or blows past a deadline, it has a ripple effect through the entire project.
You need a way to oversee the project schedule, so that you can ensure that tasks are completed in the correct order and deadlines are being met. This is when it’s important to know how to use a Gantt chart for project management.
What exactly is a Gantt chart?
A Gantt chart is a project management tool that displays tasks compared to time.
Tasks are represented by horizontal bars. The length of those bars represents the amount of time that task has been allotted.
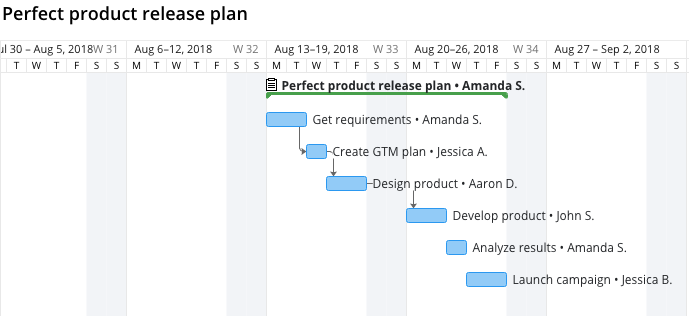
Here’s a project management Gantt chart example that displays the tasks involved with the release of a new product:

Looking at the chart, you can see the order that the tasks need to be completed, how long each task should take, any overlap between tasks, task dependencies (indicated by an arrow), and even who is assigned to each task.
What are the benefits of a Gantt chart in project management?
Chances are, you’ve heard about Gantt charts before. But do they really live up to all the hype? What makes these charts so helpful?
Handling project management with a Gantt chart offers numerous benefits, including:
- Detailed scheduling: Scheduling is a challenge for most project managers, but a Gantt chart gives you a tool to estimate how long tasks will take and manage any stakeholder expectations accordingly.
- Accurate task planning: Most projects require that tasks be completed in a specific order. For example, you can’t design a new product before you’ve gathered the requirements. A Gantt chart empowers you to plan tasks in the right order and also spot any dependencies that you and your team should be aware of.
- Improved efficiency: Being able to think through and plan out tasks in this way improves the efficiency of the project and your team, as you eliminate roadblocks that occur when task dependencies aren’t appropriately communicated or planned for.
- Increased accountability: Projects can often feel like big houses of cards — one mistake or missed deadline, and the whole thing comes toppling down. Having a Gantt chart in project management as a reference point for you and your team increases accountability, as it clearly illustrates the domino effect that can happen when even one task falls short. After all, a Gantt chart literally looks like a row of dominos.
Gantt charts are useful tools for planning and scheduling projects, but that doesn’t mean there aren’t any rules for how they should be leveraged. Like any other tool, they have their time, place, and appropriate use cases.
Curious about when you should and shouldn’t use this type of chart? Here are 4 ways not to use Gantt charts for project management.
1. Don’t use your Gantt chart for an initial project plan
Creating a Gantt chart shouldn’t be your first step when planning a project, as it’s not an adequate tool for figuring out all of the intricacies involved.
Why? Well, in order to use a Gantt chart effectively, you’re required to already have a solid grasp on things like:
- What major tasks are involved with your project
- Roughly how long those tasks should take
- The general order those tasks should flow in
If you attempt to break down your project in this way as you’re completing a Gantt chart, you run the risk of missing a task or step entirely — and then needing to redo the entire chart once you realize what was skipped.
Your Gantt chart should be treated as a visual representation of the timeline of your project rather than an aid you use to find the best approach in the first place. That’s something you should know before even starting your chart.
2. Don’t use your Gantt chart for resource management
Gantt charts are great for displaying the amount of time a specific project (and its related tasks) will take, but it falls short when it comes to breaking down all of the resources involved.
This means Gantt charts can be a highly misleading way to manage your resources. Remember, the main focus of your Gantt chart is to display only time involved and not necessarily other important constraints like project scope and overall cost.
For example, tasks represented by shorter bars on the Gantt chart take less time to complete. But they also might require more resources in terms of additional team members, necessary equipment, or budget.
That’s not depicted on your Gantt chart. So while this tool is useful for scheduling, make sure you have another way to keep an eye on your project resources to ensure they’re being used as effectively as possible.
3. Don’t manually create your Gantt chart
Many organizations and project teams choose to create their Gantt charts in Excel or some other program that requires a lot of manual entry and updating.
It definitely works — you’ll end up with a Gantt chart to use. But that process is not only time-consuming, it also means you’re left with a chart that’s completely inflexible.
What if something needs to change? What if a task needs to be moved? What if you find out that a step is going to take a lot longer than you had anticipated?
The only thing you can do is start over and recreate your entire chart to reflect those necessary changes.
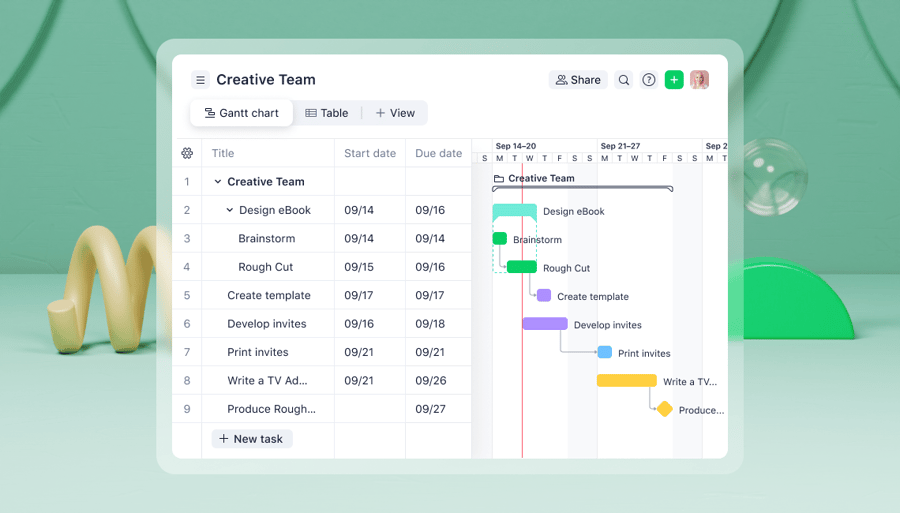
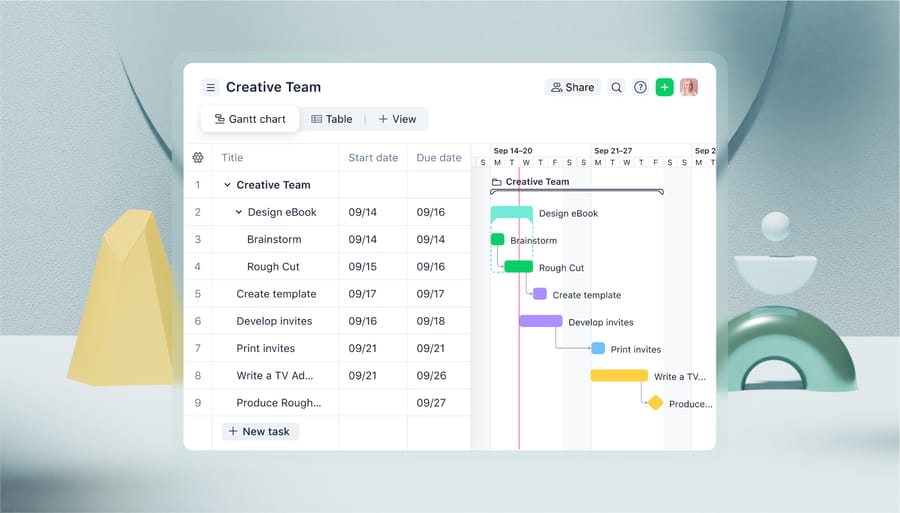
This is why it’s better to look for project management software with Gantt chart features (like Wrike’s Gantt chart software). By building your chart in a platform like this, you can make those adjustments, and the entire chart (including timelines and dependencies) will shift and update automatically, saving you stress (not to mention a ton of time).
4. Don’t set your project plan in stone
Think you can create your Gantt chart and then refer to it as a totally finalized, rigid project timeline? Think again.
Like with any other project or project management tool, things happen. You’ll need to make changes, and your chart will have to be updated as your project progresses and you gather new information.
Rather than viewing your Gantt chart as something that will ever be finalized, think of it as a living, breathing representation of your project’s progress.
Again, this is why it’s beneficial to build your Gantt chart using a project management platform rather than in Excel or something comparable. You’ll have far more flexibility to adjust when things inevitably come up.
Using Gantt charts for project management: An effective way to schedule your projects
As with any other tool, Gantt charts aren’t useful for every single aspect of project management. But when it comes to mapping out your overall schedule for a project (like in the case of launching a new product or building that comprehensive resource library), these charts are a reliable way to plan the order of tasks, understand dependencies, and get a grasp on how long the entire project should take to complete.
With an online Gantt chart in your back pocket, you can proactively navigate any potential delays or bottlenecks and ensure that your project stays on track — without a ton of unnecessary stress and confusion.
Check out these posts for more Gantt chart tips and tricks:
- A quick start guide on how to use a Gantt chart for project management: The Project Management Beginner’s Guide to Gantt Charts
- For templates to kick-start your projects: Say Goodbye to Gantt Charts in Excel With These Project Management Templates
- How to make the best use of your Gantt charts: How to Use a Single Gantt Chart for Multiple Projects
- To compare and contrast calendars and Gantt charts: When to Use a Project Calendar vs. a Gantt Chart
- Save time and optimize with online Gantt charts: How to Use a Gantt Chart to Avoid These Project Management Mistakes


