Key takeaways:
- What are the new Table view features in Wrike? Advanced filtering allows for precise data retrieval, including time frames and status searches.
- How does Wrike Mobile improve accessibility? The new Table view grouping provides seamless access to project tools and functionalities on mobile devices.
- What is the purpose of the full-profile view feature? It enhances team collaboration by providing quick access to detailed user information.
- How can users track and analyze time effectively? Customizable timesheets facilitate grouping and sorting of time entries for better resource management.
- What new enhancements does Datahub offer? Users can now change field types in their databases, improving flexibility and data integrity.
We’re loving the brighter days as spring brings much-needed sunshine and a whole host of exciting new developments here in Wrike.
This month, we’ve put our “customer-focused” value front and center with a range of changes that were directly inspired by our global community. From new Wrike Mobile features to better timesheets and even more powerful data management tools, we’re making work flow for more than 2.4 million people.
Ready to dive into this month’s Wrike news? Explore our latest roundup below!
New! Advanced filtering in Table view
We know you need important information quickly. That’s why we continually update our views with new features and functions. Our latest enhancement to Table view is advanced filtering, which allows users to:
- View tasks or projects within specific time frames, such as the last/next X days, weeks, months, or years
- Exclude specific items using the “IS NOT” filter
- Quickly locate items by their titles
- Easily search for specific statuses
- Filter using calculated custom fields for deeper insights
- Apply multiple conditions to a single field, such as filtering by the assignee
- Filter items by the properties of their parent tasks or projects
- Filter by column to accelerate searches
This helps enhance our customers’ data interaction and analysis capabilities, facilitating more precise data manipulation.
It’ll also improve efficiency in project and task management, helping you get instant visibility into tasks, projects, spaces, and more. This cool new capability is currently in our Labs, but account owners can request activation through Wrike Support.
Wrike Mobile gets a fresh functionality boost
Picture this: You’re trying to finish work on time today, to get home to an important family event this evening. You’re against the clock, and decide to finish a task on your commute home. When you open your Wrike app on your cellphone on the train or bus, you see everything exactly how you left it in the office, right down to the grouping you created in your table.
That’s all possible with brand-new Table view grouping for mobile. You can even access space-level tools now too, allowing you to jump into calendars or dashboards directly, with fewer taps on your phone.
These are just a few of the many ways we help our customers access critical project tools on the go — and work anywhere, anytime.
Build detailed user profiles
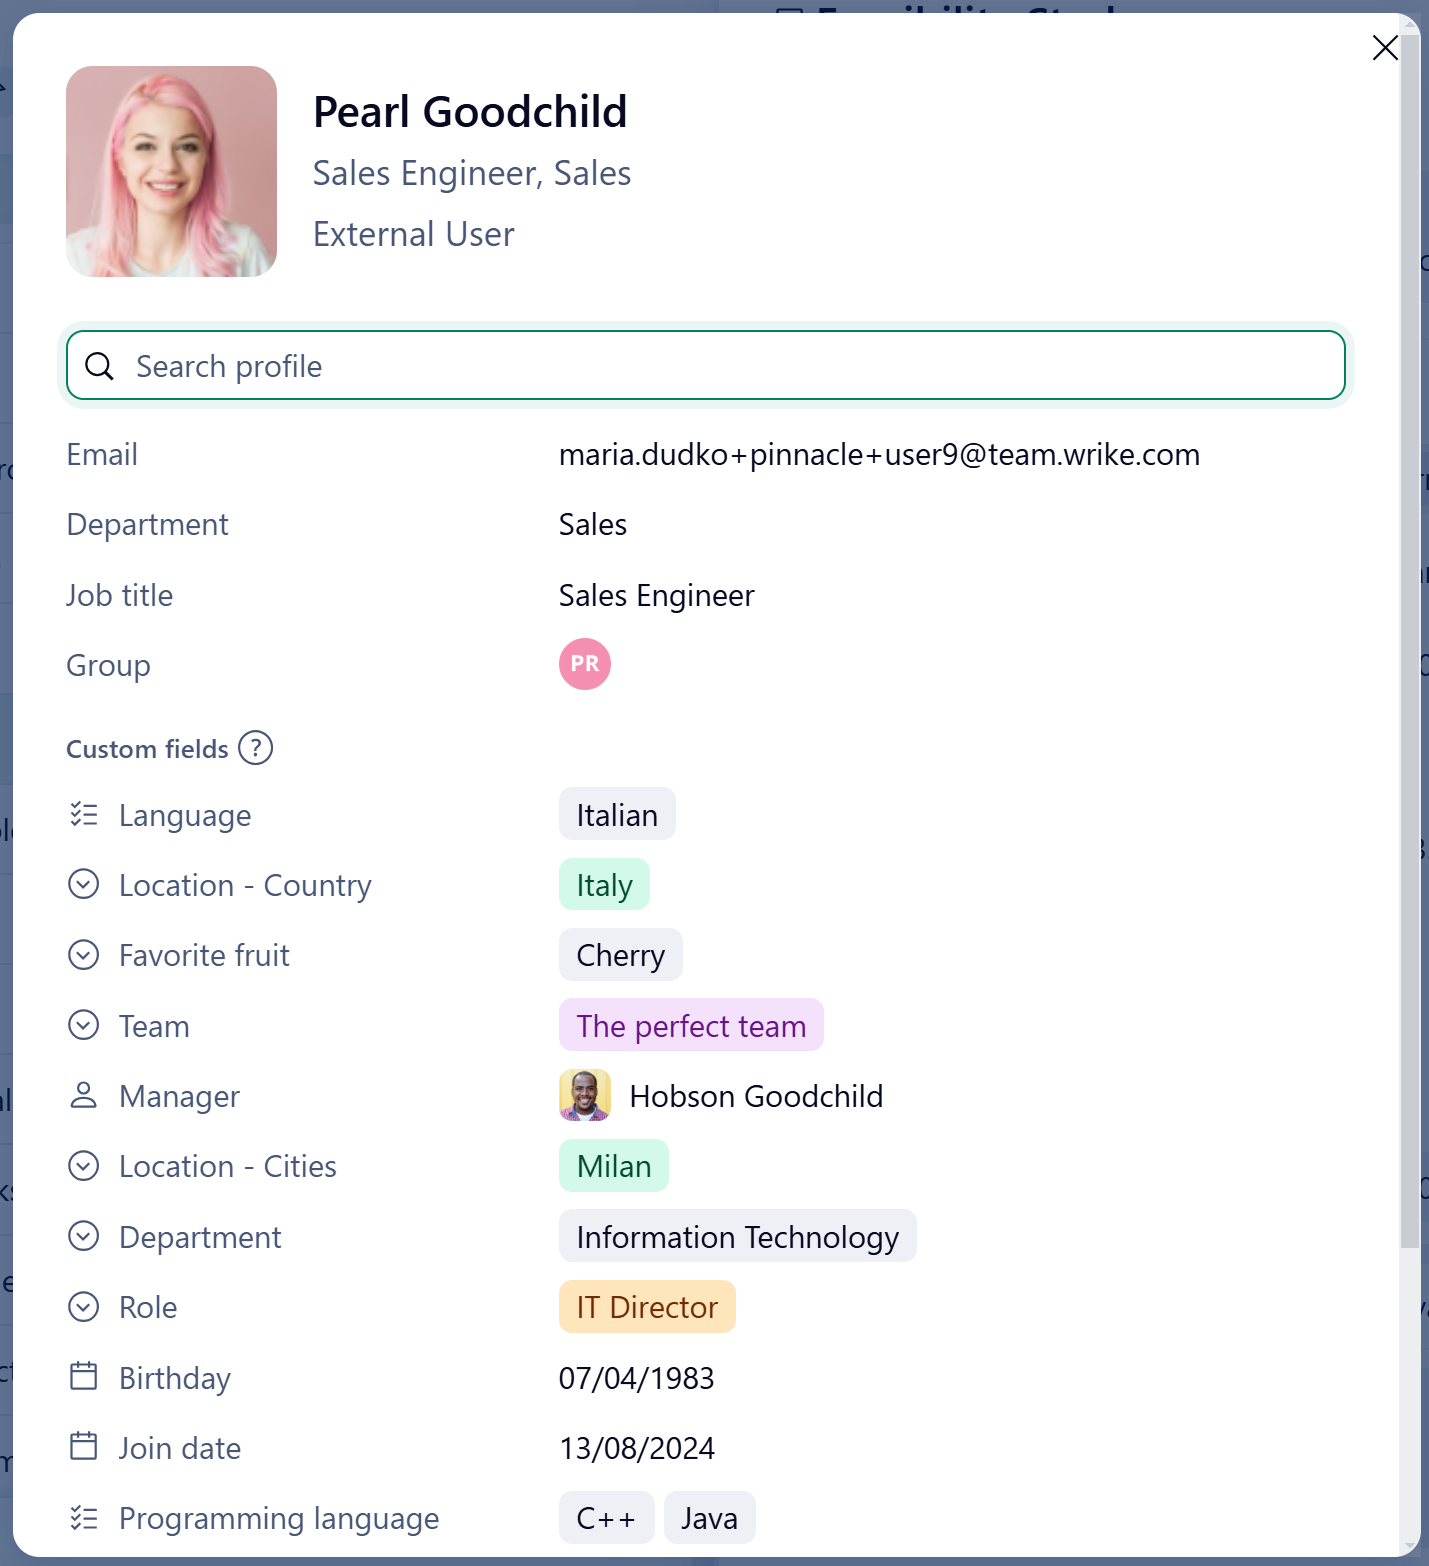
Trying to remember who your Mandarin-speaking marketer is? Or which IT engineer covers night-time callouts? Our new full-profile view feature makes it easy to view all the information you need, fast.
Available to all Pinnacle accounts now, the full-profile view will facilitate better team collaboration, communication, and connectivity. Simply hover over or click on a person’s icon, and then view their full profile to get started.

More ways to track and analyze time
If it’s important to you to maximize every resource, you’ll love our new metric-measuring tools.
First up is a marriage made in resource management heaven: Table view and timesheets. Now, you can customize timesheet views with grouping, field management, and more. You can even distinguish work by additional fields, sort by relevant fields, and review time spent across different dimensions.
So, what does this look like in real life? Say for example, you’re analyzing last quarter’s results, working to identify your most time-consuming projects. This new functionality means you can easily:
- Group and see time spent by billing type
- Group and see time spent by client
- Group and see time spent by status
- Sort by status to see where the most attention for time entries is needed
- Disable certain columns if they are not in use to remove the clutter (e.g., non-working days)
While this change is currently in Beta mode, we’re working to make it available to Business, Pinnacle, and Enterprise customers soon.
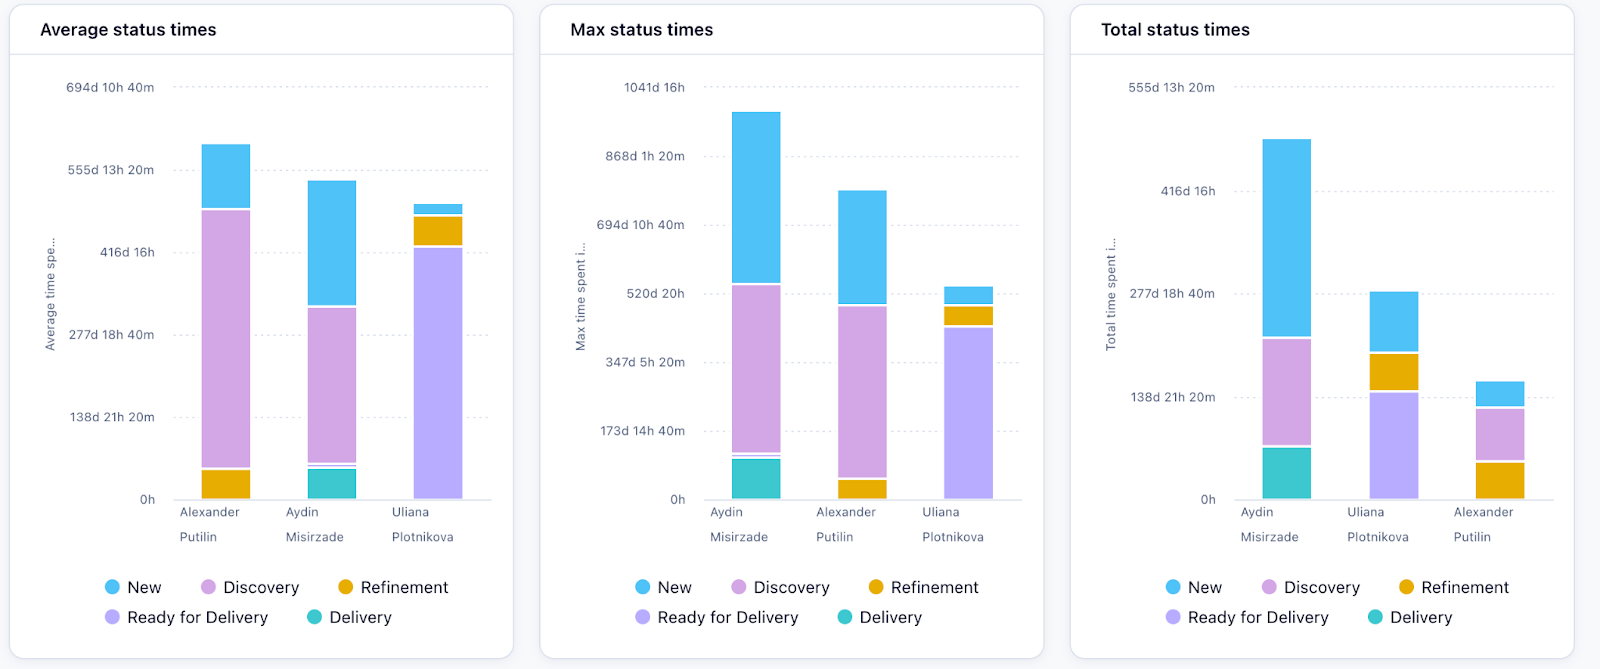
In the meantime, Pinnacle customers can now access new workflow metrics that’ll help you better understand your teams’ work history. For instance, you can track time spent in specific statuses, analyzing:
- Total time spent in status
- Max time spent in status
- Average time spent in status
- Status changes
Plus, we’ve just released three new templates for workflow analysis, including:
- Interrupted workflows
- Average status times
- Total time active
More information on these exciting changes is available in our Help Center.

Datahub gets even more powerful
Ever since we launched Datahub last year, we’ve been thrilled with how quickly the Wrike community embraced it. The best part? As our users put Datahub’s powerful abilities to work, they’re giving us valuable feedback about how to make it even better.
One of our most-heard requests was the ability to convert field types. So as usual, you asked and we answered.
In the past, if you created a field in a database, you were stuck with that type, whether it was built via CSV, API, or manual additions.
Now, you can easily reconfigure your database field types by simply selecting “Change Field Settings.” This provides much-needed flexibility and adaptability in database management and reduces the risk of data entry errors.
It’s all part of our efforts to enhance data integrity, as we all know that the best decisions are based on the most accurate information. Keen to know more? Check out our Help Center article.
If you like to stay up to date with all things Wrike-related, you might like to join our new Wrike Admins and Champions Hub. It’s a dedicated space for our most experienced customers to share best practices and discuss workspace optimizations. Explore our forum here.
In the meantime, you can watch our new releases in action in our on-demand deminar, “What’s New in Wrike.” Or scroll through our latest release notes to learn more about how we’re putting a spring in our customers’ steps this March.
Join us next month to see what “egg-citing” news we have in store for April!


