How To Use a Gantt Chart for Project Management
A Gantt chart is a popular project management tool that provides a visual of what needs to be done and when. Originally developed by Henry Gantt in the early 1900s, Gantt charts are often displayed as a bar chart, where each task is represented by a bar along a timeline.
Gantt charts are excellent for tracking project schedules because they help you see interdependencies between tasks — in other words, when one task relies on another to be completed. Gantt charts can also be used to show progress, resources, constraints, and other relevant scheduling information.
In this guide, you’ll learn how to build a Gantt chart for different types of projects. We’ll also show you how you can use Wrike’s Gantt charts to track project budgets and manage timelines.
Components of a good Gantt chart
A Gantt chart should include all of the following data points:
- The project start date
- The name or description of each project task
- Resources assigned to each task
- A start and end date for every task
- The duration (length) of every task
- The relationship between tasks
- The project end date
Task dependencies in Gantt charts
You wouldn’t start painting a room until the walls are built, right? When managing a project, not all tasks happen in isolation. Often, one task depends on the completion or start of another task. This is where task dependencies come in.
In a Gantt chart, not all tasks are dependent but they should be connected. A task with no relationships or dependencies may be referred to as a hanging or orphaned task. Orphaned tasks are against PMBOK standards as they can complicate planning and analysis. However, it is possible to have multiple groups of coinciding tasks. Understanding these connections ensures your project plan runs smoothly, avoids confusion, and keeps everyone on the same page.
When you create a Gantt chart, it’s important to define task dependencies clearly. Whether using a Gantt chart in Excel, Google Sheets, or online software, identifying how tasks are related helps you track the project’s progress quickly, making it easier to spot bottlenecks or delays early on.
Types of task dependencies in Gantt charts
There are four types of relations or dependencies to choose from:
- Finish to start (FS): One task must be completed before the next can start. This relationship is the most common option.
- Start to start (SS): In this case, several tasks can begin simultaneously. Think of a housing project, for example — once you start putting up the drywall, someone else can begin painting. There’s no need for the whole house to be drywalled before beginning to paint the first room.
- Finish to finish (FF): In some cases, a task cannot end until the previous one is completed. For example, the inspection of a house cannot be done until the house is fully built.
- Start to finish (SF): This is the least common task relationship, where one task cannot end until another is started. Shift work is a good example of this — the employee on the day shift cannot finish until the employee on the evening shift comes in.
The benefits of using a Gantt chart for project management
Using a Gantt chart for project management, you can:
- Break down a project into more manageable chunks
- Easily view task dependencies and relationships
- Allow team members to view the relationship between their work and others’
- Visualize and monitor the progress of tasks over time
- See constraints and conflicts, such as one resource being assigned to two tasks at once
- Identify the critical path of the project
There are a number of reasons why your project can fail. By using a Gantt chart, you narrow down this likelihood and give your project a fighting chance at success.
Gantt chart examples
PMI offers multiple examples of Gantt charts in project management, including specific ones for Agile and Lean teams. These visuals give a high-level overview of key data points, including milestones and dependencies. They can be shared with project stakeholders, allowing them to monitor project progress at a glance.
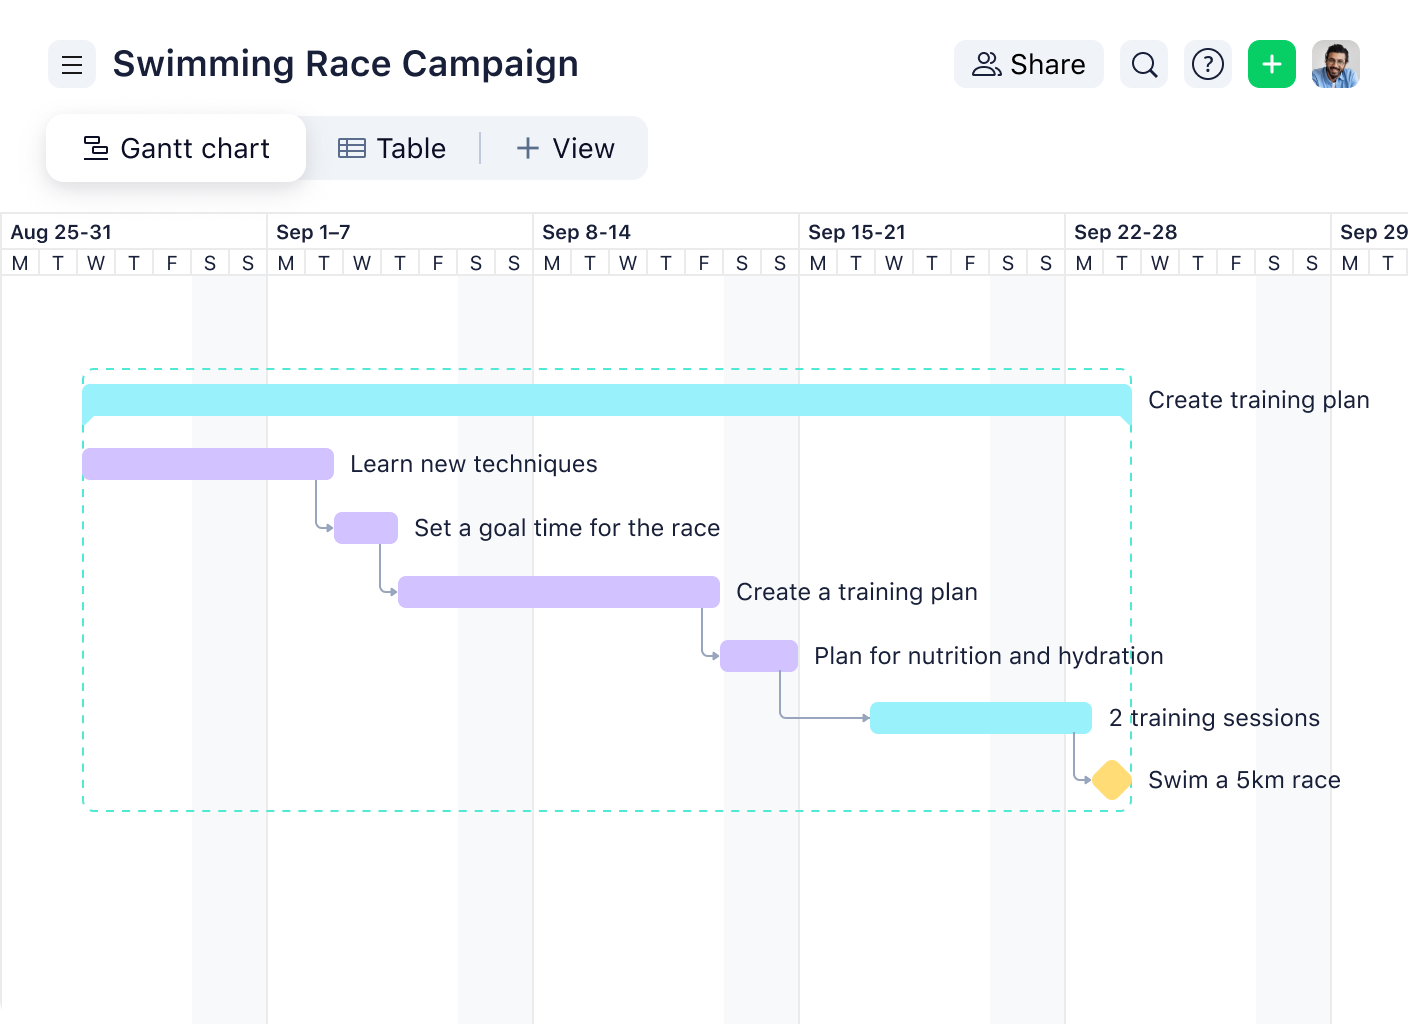
With Wrike, you can create custom Gantt charts for any type of project. For example, here’s what a simple sports campaign might look like:

You can also use Wrike’s Gantt charts for more complex projects that involve multiple teams and departments. For example, in a creative campaign, there would be individual tasks for each relevant team, such as content, design, and web development.
How to build a Gantt chart for project management
It’s easiest to set up, update, and manage a Gantt chart using a project scheduling tool that allows you to link tasks and deadlines that are dependent on one another. When working in an effective project scheduling tool, moving or updating the timeline or progress on one task will automatically update any interdependent tasks. This function saves you time and reduces the likelihood of your team missing something important.
If necessary, you can create a manual Gantt chart in a spreadsheet by following these steps:
- Identify all your essential project tasks. Make a list of what needs to be completed and how long you expect each task to take.
- Identify the relationships between the tasks. For example, you can’t post content on your website until the content is written, so these two tasks are related. One needs to be completed before the other can begin.
- Put all your tasks in order of timeline in your software or spreadsheet. Begin with your starting task, and end with the activity that completes the project. Everything else can fit in the middle based on relationships and your resources, availability, etc.
- At this point, you can add dates, resources, and progress (if the project is already underway). You can also input any other relevant information you want to track.
- If you’re using project management software, it will automatically create a chart for you. Using a spreadsheet, you will have to create and format a chart manually.
- Once your chart is created, remember to update it as things change. It’s important to review your chart at least once a week to reflect progress and other changes to your project.
How to use a Gantt chart for different projects
Need a clearer picture of how a Gantt chart works in different industries? Here are specific examples that show how Gantt charts can be applied in real-world projects.
Construction
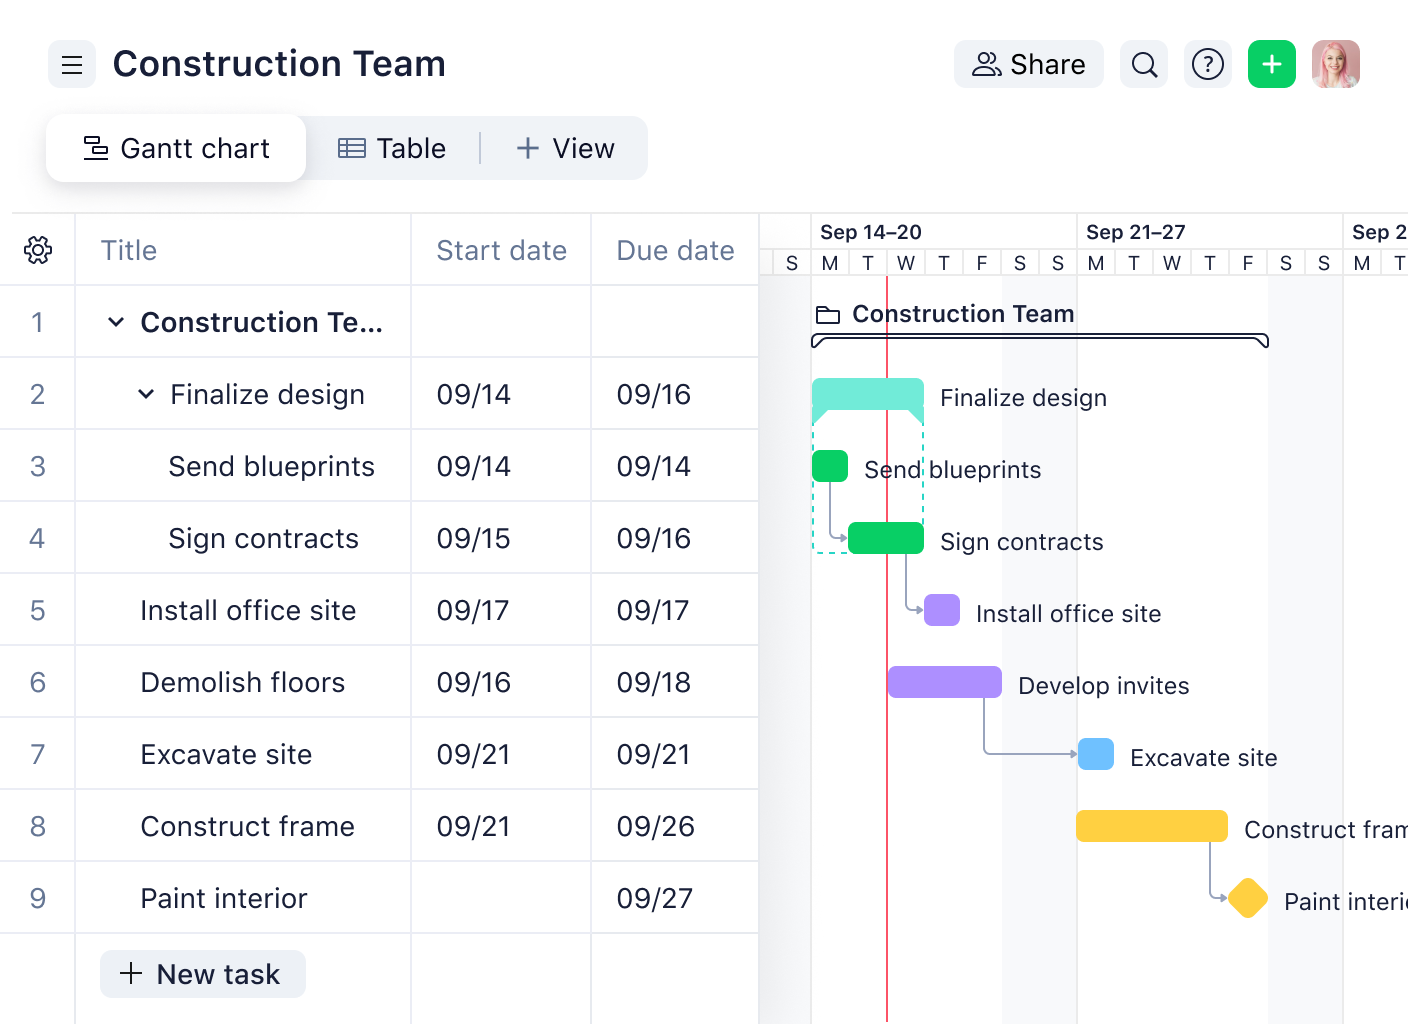
Every phase in a construction project, from foundation work to final inspections, must be organized carefully. A Gantt chart allows project managers to map out sequence tasks like electrical installations and plumbing. Creating a clear visual timeline makes it easier to manage resources and avoid conflicts between contractors.

Software development
Software development can be complicated, with different teams working on coding, testing, and debugging simultaneously. A Gantt chart allows you to assign tasks to the backend, frontend, and QA teams, as well as set individual deadlines.
Event planning
How do you keep track of all the moving parts in event planning? When organizing a major event, like a conference or wedding, many tasks need to be coordinated — securing the venue, hiring vendors, and managing guest lists. You can create a template that maps out every key milestone, from sending invitations to finalizing the day-of schedule.
Marketing campaigns
Managing a marketing campaign means handling multiple tasks, including content creation, social media scheduling, and email marketing. A Gantt chart helps you visually track the entire campaign’s timeline. This way, you can monitor progress in real time and track every aspect of the campaign.
What Gantt chart software should you use?
Looking for the best Gantt chart to manage projects? There are several options out there for project teams.
For simple projects, you can start with Google Sheets or Microsoft Excel, both of which have templates that allow you to build a project management chart from scratch. These tools are sufficient for small teams or individual projects that don’t need advanced Gantt chart features.
However, as mentioned above, it’s preferable to use a project scheduling tool over a spreadsheet. If you’re managing a project with multiple aspects — like resource management, collaboration, and reporting — you’ll save time by using a dedicated project management platform with a built-in Gantt chart feature, like Wrike.
Manage your project schedule with Wrike’s Gantt charts
By now, you‘ve learned how to create and use Gantt charts to track and manage projects. But why stop there? Wrike doesn’t just track tasks — it oversees your project lifecycle from start to finish.
With Wrike, you can:
- Break down complex projects into manageable tasks and assign them to team members
- Make updates to milestones and deadlines in real time, ensuring everyone is on the same page
- Optimize your team’s workload by efficiently assigning tasks and balancing project scope
- Get a personalized view of your project timeline and key metrics all in one place
- Use ready-made templates to streamline your whole project setup and save valuable time
- Keep track of time spent on each task to ensure you’re staying within project deadlines
So, what are you waiting for? Try Wrike’s online Gantt chart software today.

Artem Gurnov
Artem is a Director of Account Development at Wrike. He previously held the role of Project Manager, overseeing a team of customer success managers (CSMs). Over the years of building teams and scaling business processes, he has successfully deployed multiple projects, from automating client outreach to setting up work prioritization tools for sales reps and CSMs.


