What is a Gantt Chart in Project Management?
What is a Gantt Chart in Project Management?
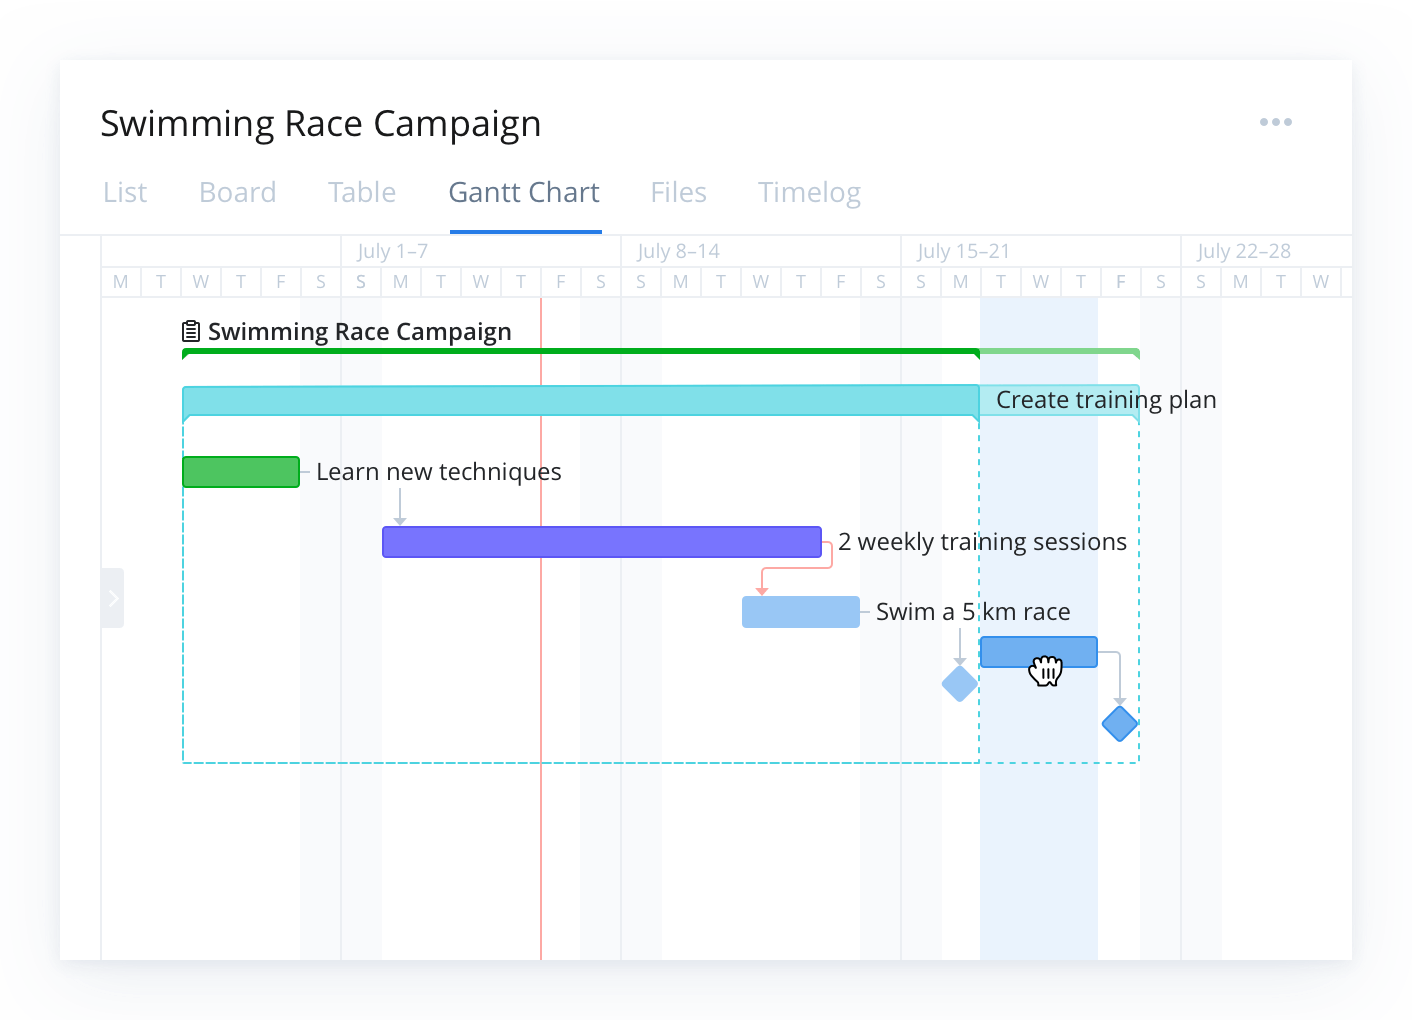
A Gantt Chart is a table that illustrates the course of a project and all the elements involved. Simply put, it is a timeline view of all your upcoming tasks and deadlines.
This visual was first developed by Karol Adamiecki in 1896 before Henry Gantt devised his own version which illustrates a project schedule in the 1910s. Gantt Charts are a useful tool to see the entire landscape of either one or multiple projects. It helps you view which tasks are dependent on one another and milestones that are coming up.


Artem Gurnov
Artem is a Director of Account Development at Wrike. He previously held the role of Project Manager, overseeing a team of customer success managers (CSMs). Over the years of building teams and scaling business processes, he has successfully deployed multiple projects, from automating client outreach to setting up work prioritization tools for sales reps and CSMs.


