Why Should I Use Gantt Charts in Project Management Software?
Why Should I Use Gantt Charts in Project Management Software?
A Gantt chart is a type of bar chart that represents your project schedule visually. The Gantt chart was the first formal technique for managing projects and is still a staple tool in project management today. The Gantt chart is likely the single most widely used technique for visually portraying project schedules.
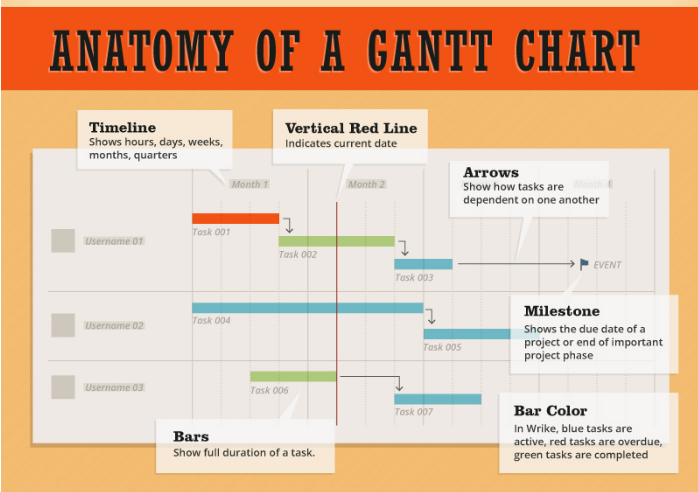
A Gantt chart displays tasks compared to time, with tasks represented by horizontal bars. The length of each bar represents the amount of time that task has been allotted. This view allows you to quickly see:
- What tasks are coming next
- How long each task will take
- When tasks need to be started and completed
- Any overlap between tasks
- Task dependencies
- Who is assigned to each task
Milestones typically appear on a Gantt chart as diamonds or stars, and each represents a single point in time with no duration.

Most criticisms of Gantt charts revolve around the level of work required to keep them updated. In the past, you might have used a tool like Excel to build a Gantt chart and visualize your project.
However, as projects become more complicated or alter course, it’s difficult to maintain this manual method. Without project management software, the chart needs to be continuously recreated every time a change is made.
Due to the size and complexity of this feat, manual Gantt charts tend only to show summary views. Or they become abandoned and obsolete before the project is finished.
With project management software, you can maintain an up-to-date Gantt chart in real time with little effort. Plus, you can modify views to either see a high-level summary or drill down to the detail.
Reasons to use a Gantt chart
Gantt charts are not the only scheduling tool available. But here are five reasons why they can help you better manage your project:
- You can brainstorm your initial scheduleA Gantt chart can be an effective way to create your initial project schedule and workflow. The largest advantage of using a Gantt chart as the starting point for planning your project is that it’s visual. You can display it on a large screen in a conference room and walk through it with your team much more easily than a list or table of tasks. A Gantt chart can accomplish the same objective as a mindmap — it enables you and your team to capture all of your ideas in one spot for a great overview. You can then drag and drop and reorder tasks as people think up new requirements, dependencies, and milestones.Using a visual timeline, you can also easily see how much work can occur at once and how long the work and overall project are expected to take. This can help determine resource requirements and deadline expectations for your project.
- You can break projects downA Gantt chart can help you break a project into phases or sprints while still maintaining an overview of the project as a whole. For instance, you may have an Agile project with three different sprints involved. Using a Gantt chart, you can view each sprint separately and focus only on the tasks within each one. Or you can view the project in its entirety to keep track of how changes in one sprint will impact the others.
- You can manage deadline changesWith a timeline schedule, when you change the duration or end date on one task, it can be difficult to see which following tasks it has directly impacted. For instance, if you change a task on line six of a schedule, it could push out activities on lines 24, 32, 45, and 96. The updates will happen instantly, as long as they’re not breaking any constraints. You may not even notice that the line 96 task was pushed out, making it more difficult to plan and manage expectations about upcoming work. But when you make changes directly on your Gantt chart, it’s much easier to see the bars of other tasks shifting out. This means it offers a better way to stay on top of what’s occurring when.
- You can define the critical pathOne of the best reasons to use a Gantt chart is to easily define and monitor your critical path. Thanks to the Gantt chart's visual nature, you can quickly pinpoint which path in your schedule is the longest. This knowledge allows you to understand which tasks can’t afford to slip if you want to complete the project on time. Plus, your project management software Gantt chart can help you identify if your critical path changes due to shifting timelines. This way, you can prioritize the most important tasks without accidentally emphasizing work that is no longer on the critical path.
- You can increase accountabilityProjects can often feel like you’re juggling a lot of balls in the air. And one dropped ball can lead to them all falling. Without a Gantt chart, it’s hard to see where all of the balls are at any one time. This can lead to a lack of accountability among your team and micromanagement for you. Having a Gantt chart as a reference point increases accountability, as it clearly illustrates the domino effect that can happen when one task falls short. It allows every team member to see what they are responsible for and who and what they will impact if they miss their deadline or “drop their ball.”
Benefits of project management software Gantt charts
The biggest benefit of a Gantt chart is to help you plan around significant milestones and visualize the scope of your projects. But if you’re relying on a manual Gantt chart, this can become more cumbersome than it’s worth.
Here are three additional reasons why you should look for project management software that includes Gantt chart functionality:
- Real-time updates One significant advantage of using project management software is that it enables you to view changes and updates to your Gantt chart in real-time. Unlike a manual version, which may be outdated by the time it’s completed, a software version will continuously evolve and change whenever people complete tasks, record progress, or make changes. This functionality enables you to track your project's live progress by drilling down into the individual tasks. By watching it closely, you have a clear idea of how the project progresses, without micromanaging your team.
- Early warningsYour project management software should have the ability to color-code bars within the Gantt chart based on activities and/or progress. For instance, backlogged tasks should automatically switch from being represented with a solid color bar to a bar with striped diagonal lines. This visual effect allows you to instantly pinpoint any tasks that may be delayed before it’s too late.
- CollaborationOnline Gantt charts enable you to oversee, adjust, and share project schedule information in one space. This functionality allows you and your team to collaborate and communicate faster and easier. For instance, you can adjust assignees, dates, or project duration within your project management software Gantt chart and have your team automatically notified of the changes. They can also view progress whenever they wish, and keep tabs on their upcoming work without asking you for updates on how other team members’ current tasks are progressing.

Artem Gurnov
Artem is a Director of Account Development at Wrike. He previously held the role of Project Manager, overseeing a team of customer success managers (CSMs). Over the years of building teams and scaling business processes, he has successfully deployed multiple projects, from automating client outreach to setting up work prioritization tools for sales reps and CSMs.


